
- Node
- React.js
- SocketIO
- Arduino
- Express.js
- AWS
- Cloudflare
- Docker
- NGINX
- Blender
- Gatsby.js
Djenitor
Wednesday 9 September 2020
32 min read
Broadcasting guitar notes from localhost to the internet through a custom sensor built with Arduino and Inductors that translates electromagnetic vibrations into values to be mapped on a fretboard
Not sure how this works in other countries but in Romania, before graduating from an Engineering Profile at University you’re required to work on and submit a project related to topics that you’ve been studying during your last 4 years of courses. Since you’re able to decide by yourself what your thesis is going to be about, it’s kinda funny that the most abused topic by most of the students is just creating an Online Shop that most likely will include a regular backend API, some frontend to show off and a database to keep items organized. Even though I also had the idea of the most awesome Craft Beer Online Shop I discarded this topic because I knew many people would rather do it and I didn’t want to get lost in the crowd.
I wanted to do something that will shine and stand out of the ordinary, so then I decided to see if I might be able to integrate into such a project something from my daily life and I saw the guitar that was sitting in the corner of my room. That was the moment when the idea clicked and I knew what to develop, a Full Stack app that will allow users to broadcast live notes played on a physical instrument through the internet!
This is the Thesis about how I created my University Batchelor’s Exam Project!
Theme Choice and Motivation
Since I’ve always had a passion for music, having been also a guitarist (not continuously) for over 10 years, I noticed something weird. There are a lot of tutorials on YouTube about scales, modes, theory, and so on, heck I also learned to play guitar from the good old 2006 YouTube 320p Tutorials, and since then I never saw anybody broadcast notes in real-time on their screens. All the tabs that you’ll see appearing on screen in a tutorial or cover videos are added in post-production instead of being mapped on-screen in real-time. How it’s possible that human mankind has been able to go to the moon and didn’t invent some sort of solution to broadcast the notes from a guitar on a screen? It’s not that simple as I thought.
There is a considerable amount of effort into developing such a solution because it implies knowledge from many fields that not always are connected between each other, but since this is my expertise I wanted to give it a shot, with all the deadline pressure caused by the exam at the end of my last semester!
The name Djenitor it’s just a reference to the Djent music genre that is becoming more popular these days, derived from progressive metal and based on palm-muting, high-gain, and low-pitch guitars! Check out an example of Djent music by Plini
Music Theory
Why it’s so hard to map individual guitar notes on a virtual fretboard?
To answer this question you may wanna know how a stringed instrument works and what’s made from. Many components define such an instrument but let’s take a look at a standard 6 String Electric Guitar and highlight those that are of our interest;
- The Fretboard also called Fingerboard is the long strip of wood over whom the strings lay. Along with it, some metal bars are defining the frets themselves, one fret is contained between 2 bars.
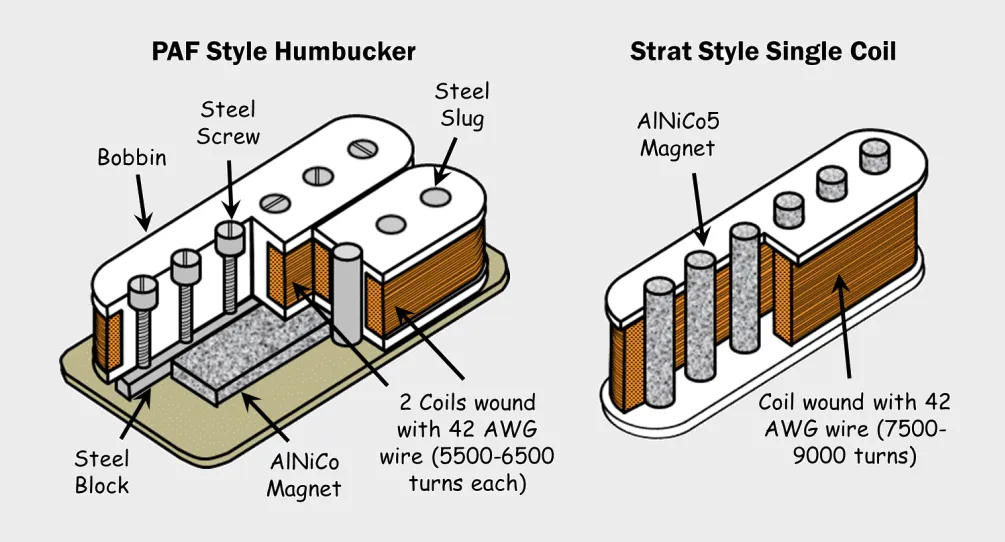
- The Pickups that are responsable for collecting the sound from the vibrating strings and output it to an external source, usually an Amplifier or AMP.
Humbucker and Single Coil Pickups and their structure, made by many magnetic poles with thousands copper wrappings with a mono analog output (AO)
When you keep a string pressed over a fret, pitch or vibrate anyhow the strings that are in tune and under tension, they produce a sound, or better, a specific musical note, when many strings vibrate at the same time you get a power chord, and here comes the problem.
Same notes on a fretboard, no matter what the tuning is, can be reproduced on many strings at once! Take a look at the below picture.
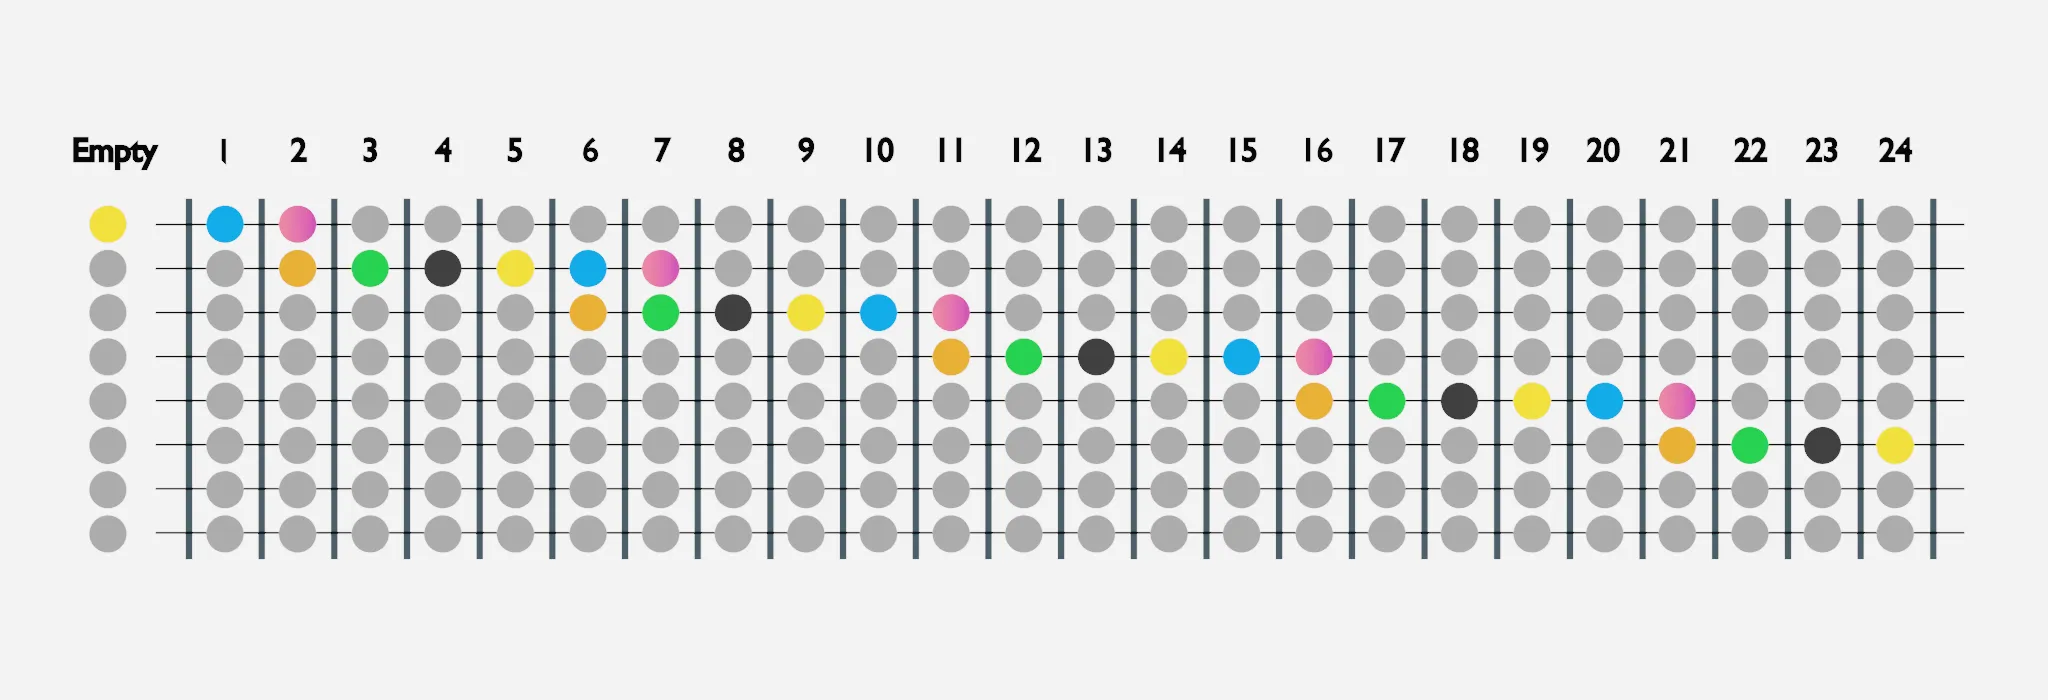
Each color represents a specific note on the fretboard, take the E note or the yellow color, it can be reproduced on the first 6 strings if the instrument has 24 frets
To clarify, all the gray notes are still repeating on many strings following the same oblique cascade pattern, the instrument has been designed this way to be able to have a wide range of notes that can be reached within the action range of human fingers, allowing to play power chords and arpeggios with ease. I chose to highlight the yellow note (E) because is the only note that can be played on all the 6 strings of an instrument tuned in E Standard with 24 frets, it’s for demonstration purposes only but the principle applies to all notes on all frets across all strings.
That’s why we cannot say what string has been producing that specific sound, even though expert musicians can distinguish them because of ear training and experience, from an electronic point of view the frequency of a note will be always the same, no matter the string that produced it, and as per many strings an instrument can have, there is always just a single mono output signal that combines the sound of all of them.
We mentioned notes and sounds before and we need to define these concepts into something that a computer can parse and interpret so that we can build the application around it. Electronically speaking, a sound can be abstracted as a sine wave whose structure is defined by the notes it’s made of. Each note has a specific Frequency (Hz) that represents the number of times the sine wave crosses the X-axis in one second.
How the Fast Fourier Transform (FFT) is Processed mathematically from an analogic signal made from voltage variation samples
The yellow E in a standard tuning outputs a 330Hz Frequency wave. As a comparison, the human ear can detect frequencies in the 20Hz - 22.000Hz spectrum, while the quality of a standard Audio CD is about 44.100Hz, so you can see that we are working with low frequencies when analyzing musical instruments, whom frequency spectrum for an 8 string, 24 frets guitar is between 46Hz and 1319Hz from the lowest note to the highest.
As stated above, the physical sensor in an electric guitar is the Pickup, a Transductor based on the inductive law that can translate the electromagnetic disturb in its range into electric signals of sound waves that correspond to the Alternate voltage change, that can then be interpreted by a microprocessor. In our case, the disturb is the metal strings that are vibrating above the Pickup and the output is a mono signal that can be then amplified.
Sensor and Circuit
To solve such an issue I created my own Pickup, but instead of one output, it’s going to have 8 separate outputs, one per string! Doing so helps us during the development process and allows us to analyze the frequency spectrum of each string isolated, allowing us to map the notes in the correct position on the virtual fretboard on the screen!
This solution covers different instruments that respect a simple condition, they need to be using metal strings, the reason for this being the sensor that I build is based on the Inductance principle of electricity. There are guitars such as the classical ones that have the high E B G strings made of nylon, this material won’t be detected by the sensor and therefore no signal will be generated for such instruments, another An example of the same kind is the Ukulele.
Physical Components
Since we’re working with AC (Alternate Current) what we need to be able to capture and store voltage variation is an ADC (Analog to Digital Converter) that can plot the sine waves generated in real-time and translate them into values. Once collected several samples (64 in this solution) we can proceed to calculate the FFT (Fast Fourier Transform) that will show us what the Frequency (Hz) is for that specific string at a specific time, remember it’s not only one string but 6 we analyze at the same time on a conventional guitar! I still made the sensor for an 8 string guitar, dreaming of buying one soon!
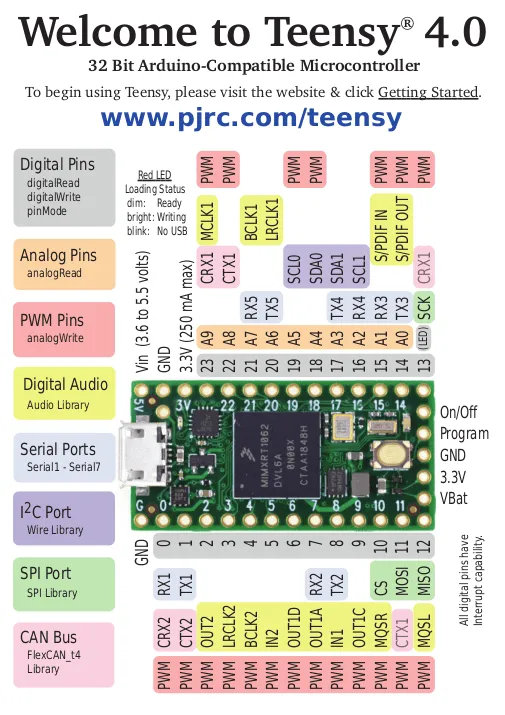
Unfortunately, a conventional Arduino is too weak to analyze so many signals at the same time in the frequency domain with a decent sample rate, a better fit has been the Teensy 4.0 Microcontroller. To make it simple, it’s an Arduino on steroids!
The basic electrical component that is the most common to the Pickup is the Inductor (L), which is made out of a magnetic core, usually Ferrite wrapped with many turns of conducting material, usually copper, with an output and ground. To get wave signals for each string of an instrument, we can place an individual Inductor under each string and then map it to the string itself in software.
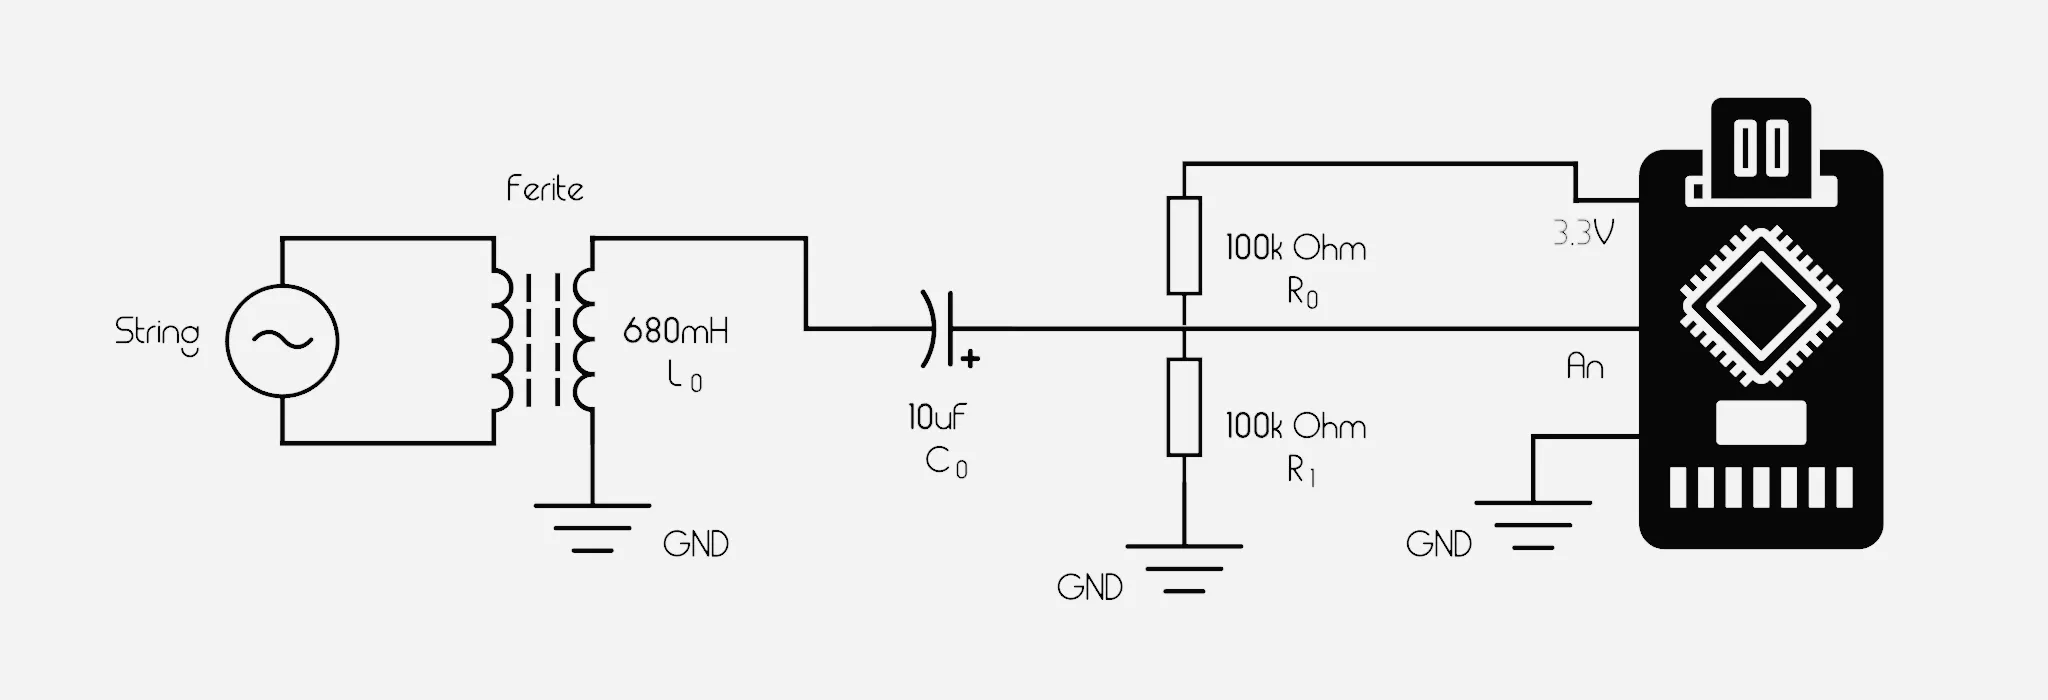
The circuit for a single Inductor, each instrument string corresponds to an Analogic Pin on the Microcontroller
The circuit itself it’s a basic RLC type circuit that combines N bobbins or coils, one per instrument string. Each coil is then separately connected to a Capacitor of 10uF and a Voltage Divider made out of 2 resistances of 100k Ohms each that will then be attached to the GND and then to the 3.3V Pins of the Teensy to center the sinusoidal analogic signal to 1.65V to be able to also read the negative values, essential for future conversion from the time domain to the frequency domain. (Microcontrollers cannot read negative Voltage from the analogic pins, that’s why we need a Voltage Divider)
Each voltage divider output is then attached to a different Analog Pin on the microcontroller where we’ll read its sample values and then translate them into the frequency domain to catch the value of the fundamental in Hz of each note, of each string at the same time!
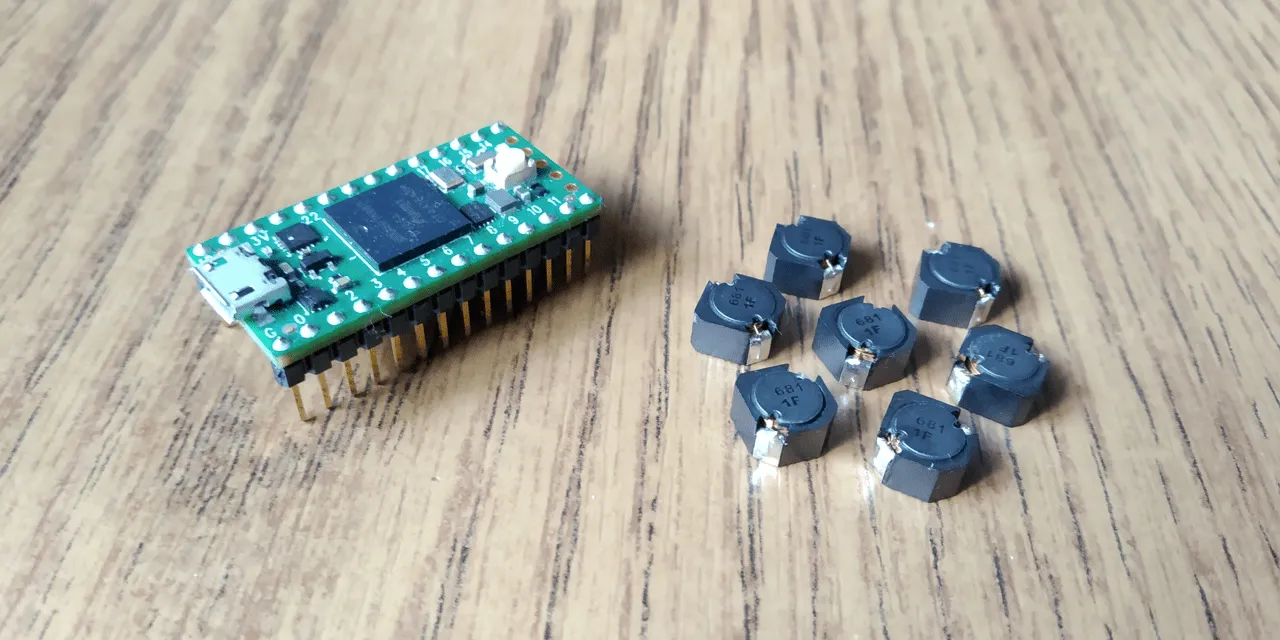
The Teensy 4.0 microcontroller along the Inductors used for this project
The Inductors used are the Power Inductor PANASONIC ELL8TP681MB
- Inductance: 680µH
- RMS Current: 430mA
- Isat Current: 300mA
- DC Resistence: 1.3 Ohm Max
- Core Material: Ferrite (magnetic)
Octaphonic Pickup
To keep the Inductors of my homemade Octaphonic Pickup correctly positioned under the strings of a guitar, I found that the easiest way was to just create a 3D model in real units that might fit my at the time Ibanez RG370 to then 3D Print it, solder the components on top of it, and fix it under my guitar strings! Beautiful instrument but with a problem, the classic Ibanez HSH Pickup positioning that left me a tight space to work with.
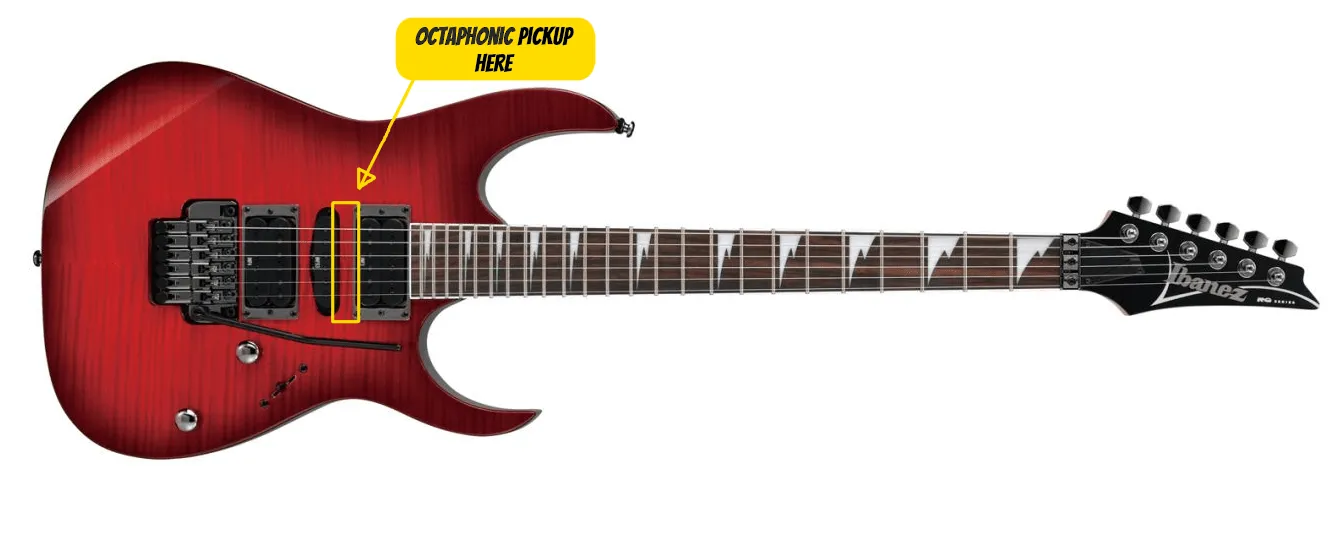
Ibanez RG370 with the marked solution pickup spot, that was really hard to achieve!
After taking measures of the space available with a caliper I started modeling a 3D case that was going to contain the inductors without being so high in altitude to touch the guitar strings once positioned underneath. The concept was a failure the first time due to the bad format for the 3D printer I had available, but after some revision, it came out pretty good, even though the material it’s pure plastic and the dimensions are contained, it solidified pretty well after the print.
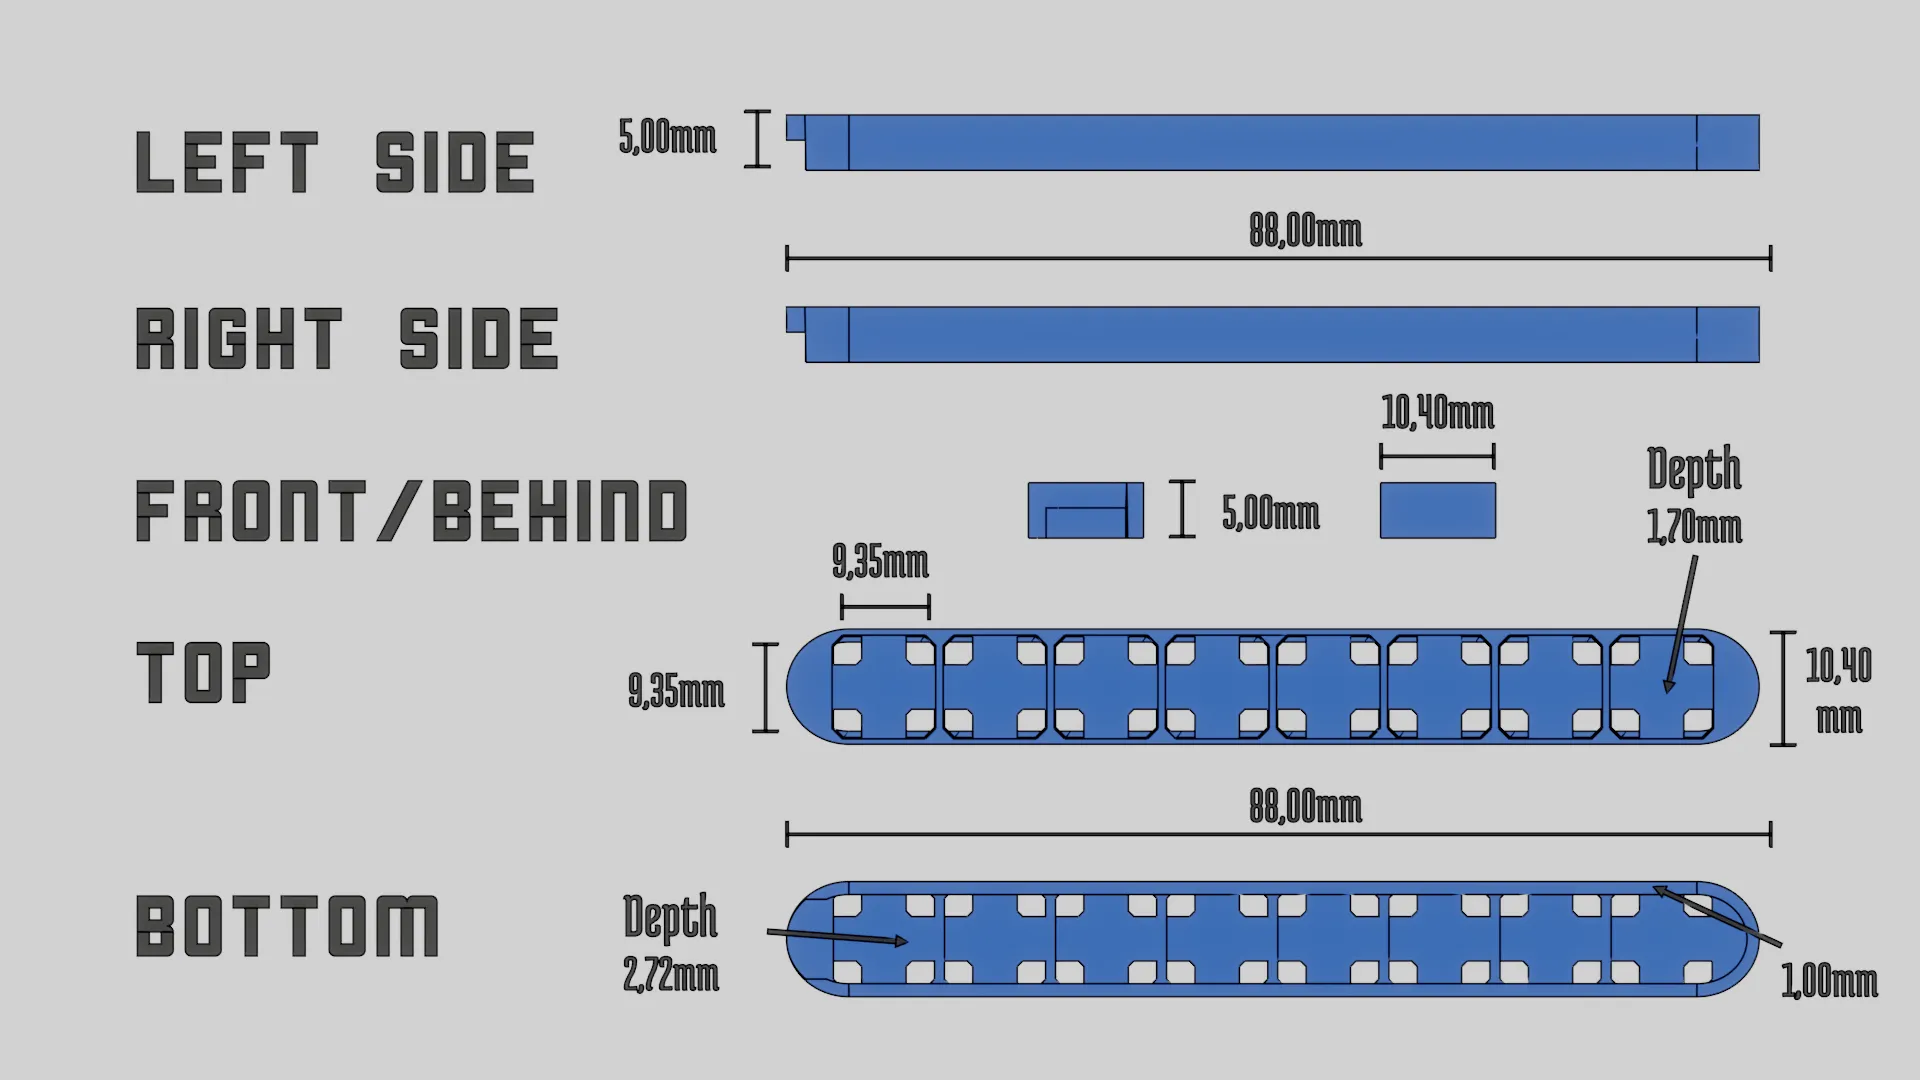
The 3D model dimensions in real units of the sensor case, to be correctly printed and fit under the strings between the pickups
To create this I used that awesome Open Source piece of software called Blender, one dirty secret of mine is that I used to model a lot in 3D when I was in high school, you know, videogames and stuff, I was addicted at the time, but it seems that it also came in handy now!
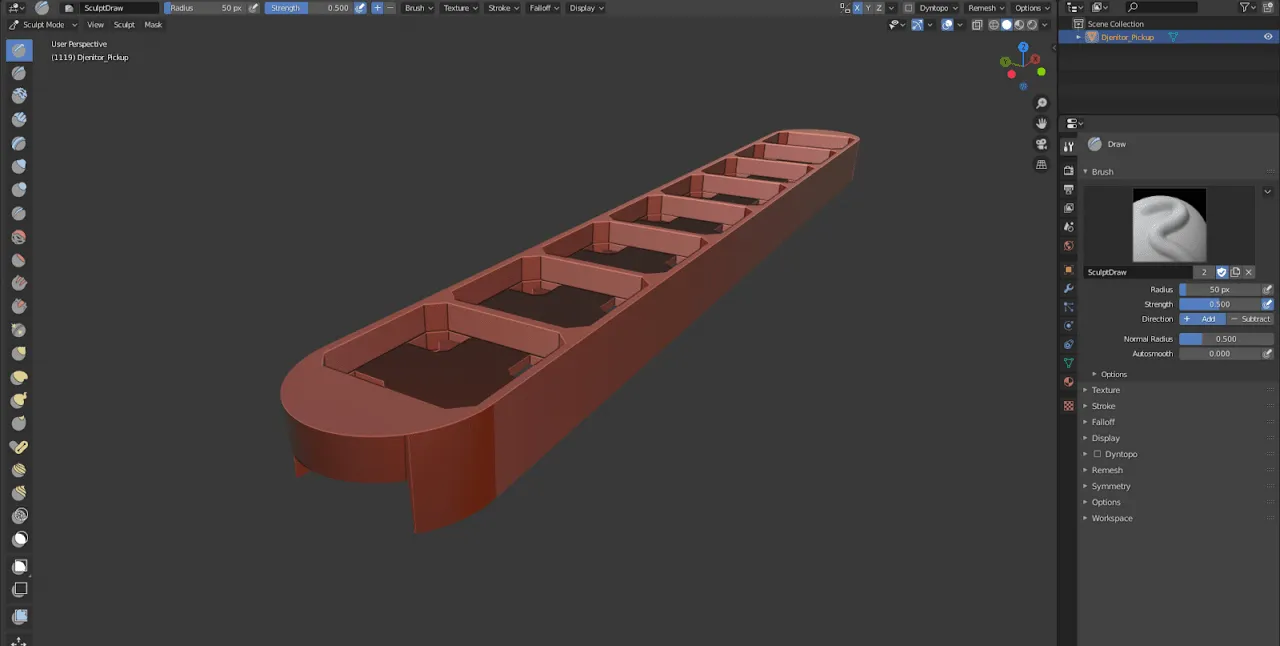
The final concept of the Octaphonic Pickup in Blender 2.81
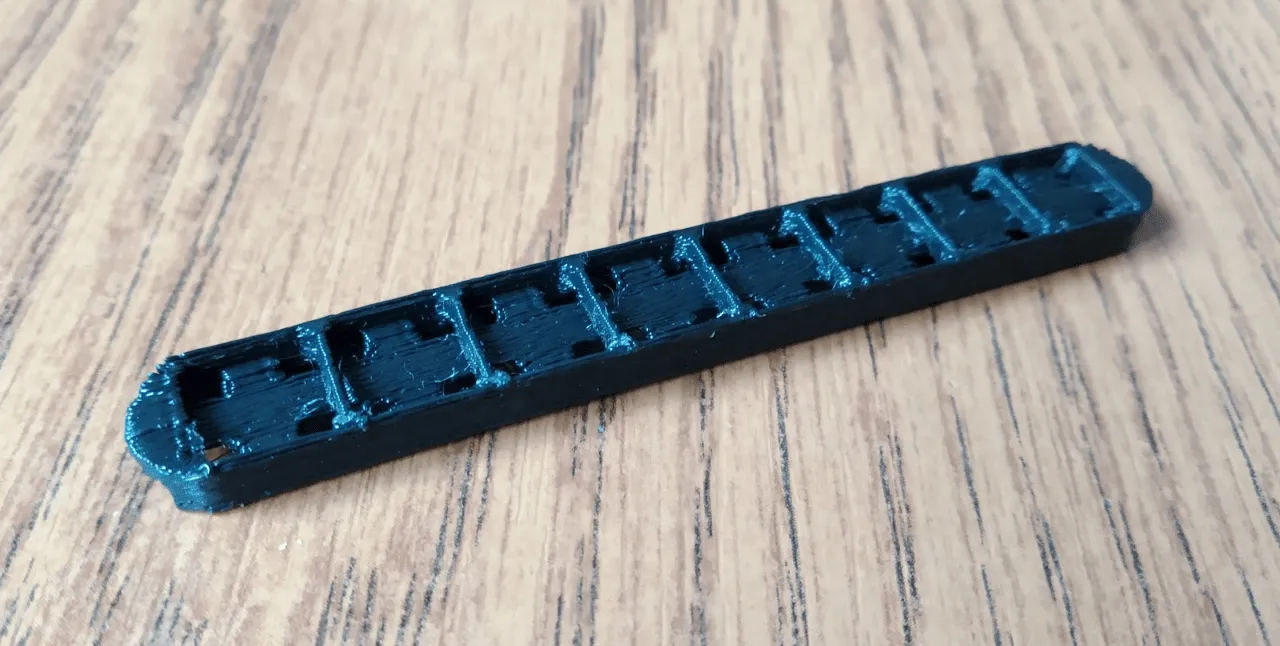
The final concept of the Octaphonic Pickup 3D Printed
To be noticed that the model has holes in it so that I could solder the out and GND and keep all the wired within the case, with an exit at the bottom of the prototype to let them reach the microcontroller analog inputs.
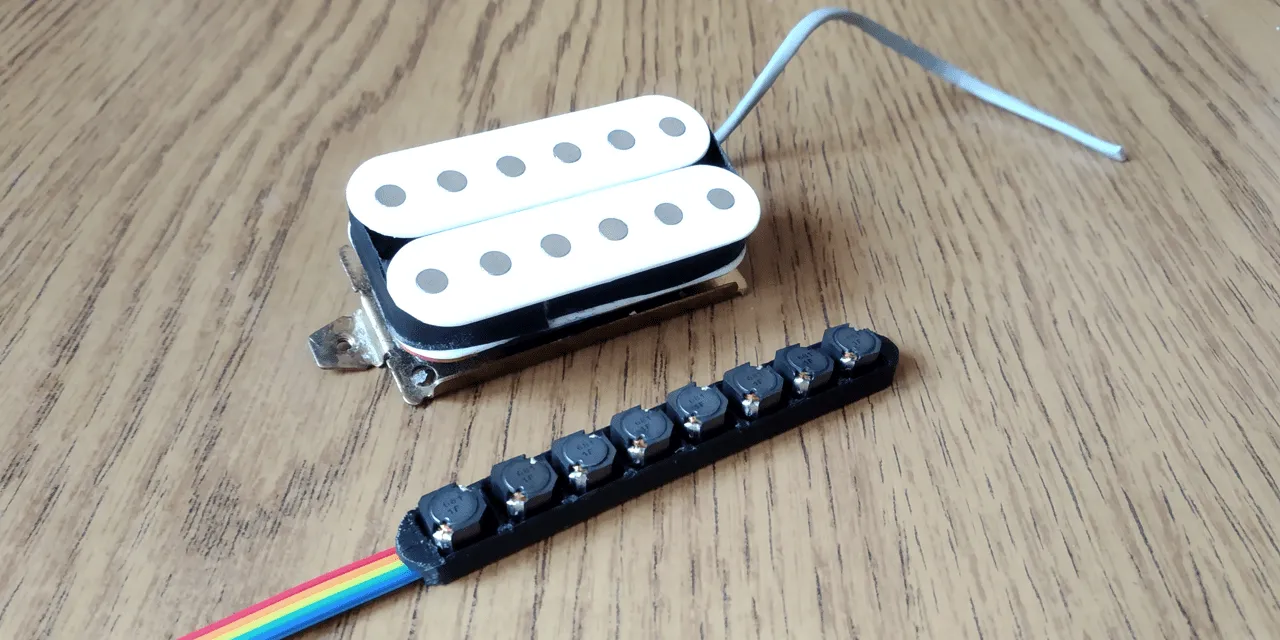
The Octaphonic Pickup 3D Printed with components solded near a real Humbucker Pickup for size comparison
Arduino Sketch
Now that I had the hardware, it was time to focus on the software by creating an Arduino Sketch to analyze the input signals and extract the frequency of each chord. Developing in C++ has been surprisingly smooth, the last time I used C++ was on my Tetris Clone University Project, good old times but those segmentation faults will mark my soul forever!
There are some external C++ Libraries involved here that need to be installed on the host before compiling the sketch and upload it to the microcontroller. They address mostly the ADC functionalities and the JSON encoder, as well as some helpers for extracting the FFT out of the wave sine samples array.
/**
 * Teensy 4.0 Sketch for Djenitor
 * Author: Șerban Mihai-Ciprian
 */

#define ADC_TEENSY_4 // Teensy 4.0 Microcontroller

#include <ArduinoJson.h>
#include <settings_defines.h>
#include <ADC.h>
#include <ADC_util.h>
#include <array>
#include <arduinoFFT.h>

#define STRING_NUMBER 8       // Number of guitar strings
#define VOLTAGE_THRERHOLD 100 // Max value for noise till pitch detection

#define SAMPLES 64              // Must be a power of 2
#define SAMPLING_FREQUENCY 2700 // Hz, 2700 for being able to analyze the highest frequency of the El String

arduinoFFT FFT = arduinoFFT();

unsigned int sampling_period_us; // Sampling period in MS
unsigned long microseconds;      // MS from last analysis

double vReal[STRING_NUMBER][SAMPLES]; // The Real part of the signal sprectum
double vImag[STRING_NUMBER][SAMPLES]; // The Complex part of the signal sprectum

// Global Pins and Names Arrays
const int pins[8] = {A0, A1, A2, A3, A4, A5, A6, A7};
const String names[8] = {"El", "Bl", "G", "D", "A", "Eh", "Bh", "F#"};

DynamicJsonDocument encode(std::array<uint32_t, STRING_NUMBER> values);
ADC *adc = new ADC(); // ADC Object that contains both ADC_0 and ADC_1
Before writing the classic Arduino setup() and loop() functions, I’ve defined a static function that is going to
parse the samples arrays of each string and return the Frequency values of each string in the following data structure:
/*
 * Encodes details from each pin in JSON and returns a serialized Doc
 * Args: None
 * Returns: A byte formatted DynamicJsonDocument Object
*/
DynamicJsonDocument encode(std::array<uint32_t, STRING_NUMBER> values) {
  DynamicJsonDocument doc(1024);
  doc["timestamp"] = millis();
  JsonArray strings = doc.createNestedArray("strings");
  // String JSON Objects
  for (int string = 0; string < STRING_NUMBER; string++) {
    JsonObject string_obj = strings.createNestedObject();
    string_obj["name"] = names[string];
    string_obj["value"] = values[string];
    string_obj["pitched"] = string_obj["value"] > VOLTAGE_THRERHOLD ? true : false; // TODO: Needs revision
  }
  return doc;
}
One of the features that make the Teensy 4.0 stand out from other similar boards is that it also incorporates
2 separate ADC on board. Usually, a microcontroller has only one or sometimes none if it’s missing analog input pins.
This means that is capable of reading and translate into numbers the voltage of 2 analog pins at the same time, making
the overall reading of all the 6 to 8 signals we need faster! This is how the setup() function looks like:
void setup() {
  adc->adc0->setAveraging(0);                                           // set number of averages
  adc->adc0->setResolution(16);                                         // set bits of resolution
  adc->adc0->setConversionSpeed(ADC_CONVERSION_SPEED::VERY_HIGH_SPEED); // change the conversion speed
  adc->adc0->setSamplingSpeed(ADC_SAMPLING_SPEED::VERY_HIGH_SPEED);     // change the sampling speed
#ifdef ADC_DUAL_ADCS
  adc->adc1->setAveraging(0);                                           // set number of averages
  adc->adc1->setResolution(16);                                         // set bits of resolution
  adc->adc1->setConversionSpeed(ADC_CONVERSION_SPEED::VERY_HIGH_SPEED); // change the conversion speed
  adc->adc1->setSamplingSpeed(ADC_SAMPLING_SPEED::VERY_HIGH_SPEED);     // change the sampling speed
#endif
  for (int pin = 0; pin < STRING_NUMBER; pin++) {
    pinMode(pins[pin], INPUT);
  }
  sampling_period_us = round(1000000 * (1.0 / SAMPLING_FREQUENCY));
  Serial.begin(2000000);
}
And now that both ADCs are setup, we can proceed to read the signals from the analog pins involved in
couples of 2 at once to take advantage of the faster read time and create more samples per second
that will also give us a better analytic precision for the signal reading. The loop() function will take
care of this:
void loop() {
  for (int sample = 0; sample < SAMPLES; sample++) {
    for (int couple = 0; couple < STRING_NUMBER; couple += 2) {
      ADC::Sync_result pinCouple = adc->analogSynchronizedRead(pins[couple], pins[couple + 1]);
      microseconds = micros(); // Overflows after around 70 minutes!
      vReal[couple][sample] = pinCouple.result_adc0;
      vImag[couple][sample] = 0;
      vReal[couple + 1][sample] = pinCouple.result_adc1;
      vImag[couple + 1][sample] = 0;
      while (micros() < (microseconds + sampling_period_us)) {}
    }
  }

  std::array<uint32_t, STRING_NUMBER> values;
  for (int string = 0; string < STRING_NUMBER; string++) {
    FFT.Windowing(vReal[string], SAMPLES, FFT_WIN_TYP_HAMMING, FFT_FORWARD);
    FFT.Compute(vReal[string], vImag[string], SAMPLES, FFT_FORWARD);
    FFT.ComplexToMagnitude(vReal[string], vImag[string], SAMPLES);
    values[string] = FFT.MajorPeak(vReal[string], SAMPLES, SAMPLING_FREQUENCY);
  }

  serializeJson(encode(values), Serial);
  Serial.print("\n");
  return;
}
Once compiled successfully and uploaded to the microcontroller, the script will output a JSON containing an object with information about the analogic pins that are connected to the inductors that will detect the sine waves of the vibrating strings in their proximity!
The JSON itself includes also a timestamp that is going to identify the exact moment in time when the reading of all the strings that happened, after some testing, with an 8 individual signal analysis, the Teensy has been able to output new results with a frequency of 1/ms which means 10 readings per second! Performance however can change based on the number of signals analyzed, by lowering the analog pins (and the instrument strings) to 7 or 6, the frequency is going to be even higher.
{
  "timestamp": 1234567890,
  "strings": [
    {"name": "El", "value": 392, "pitched": true},
    {"name": "Bl", "value": 0, "pitched": false},
    {"name": "G", "value": 0, "pitched": false},
    {"name": "D", "value": 0, "pitched": false},
    {"name": "A", "value": 123, "pitched": true},
    {"name": "Eh", "value": 98, "pitched": true},
    {"name": "Bh", "value": 0, "pitched": false},
    {"name": "F#", "value": 0, "pitched": false},
  ]
}
The above object is defining a G Chord with the frequencies of each note that are used together at the same time. Its structure is made up by:
timestampint | Represents the ms passed since the sensor turn onstringslist | A list that holds values for each signal/string analyzedindex[0:7]Object | An object with information about each stringnamestring | The string namevalueint | The frequency (Hz) of the string at the current timepitchedboolean | A Boolean to determine if the string is vibrating or not
Now that we also have the information coming from the sensor we need to collect it on a local host and send it across the internet to a common point where everyone will be able to see it.
Backend • Node.js
Implementing the backend for such a solution wasn’t easy, I’ve been considering many frameworks such as Flask but I just got that it was easier to keep it javascript-based and use Express.js that has been a good choice since it allowed me to build an easy API with Socket.IO integration easily and fast, which is good when you consider the short timespan I had available.
Initially, this has been thought of as a client and server app. The idea was to create a local app built with Electron.js that was going to capture the local data from the microcontroller and then create server-side a host app that was going to be a relay for the received data to the frontend. This idea was partially scrapped due to the deadline but I’ve still been able to create an Electron concept that wouldn’t build (multiplatform Electron builds are a pain). I was still able to use the electron local dev environment to execute a local chromium-browser that was serving my purpose of collecting data through serial port and send it further to the server that I was about to create into AWS.
To listen to the Teensy Microcontroller incoming data on the client, the following Express code has been running on the broadcaster localhost
const express = require("express");
const http = require("http");
const bodyParser = require('body-parser');
const socketIo = require("socket.io");
const port = process.env.PORT || 5000;

const cors = require("cors");
const app = express();

const server = http.createServer(app);
const io = socketIo(server);
app.use(cors({origin: "http://localhost:3000"}));

const SerialPort = require("serialport");
const Readline = require('@serialport/parser-readline');

const ENDPOINT = "https://api.djenitor.com";

const ioClient = require("socket.io-client");
const client = ioClient(ENDPOINT, {reconnection: false});

const teensy = {
  port: "",
  baudrate: 2000000,
  serial: null,
  parser: null
}

io.on("connection", (socket) => {
  console.log(`> App Connected: ${socket.id}`);

  if(teensy.serial !== null) {
    teensy.parser.on("data", (line) => {
        socket.emit("notes", JSON.parse(line));
        client.emit("relay", line);
    });
  } else {
    console.log(">>> Instrument not found!");
  }

  socket.on("disconnect", () => {
    console.log(`> App Disconnected: ${socket.id}`);
  });
});
It creates a serial port and a socket.io-client instance that is going to listen to each other, once a new JSON is going to be spawned from the microcontroller (10 per second as mentioned before) it will be intercepted and sent from the client to the cloud server backend app.
Meanwhile, on the server-side, the Express App will collect each Socket.IO Client message into the Socket.IO Server
(located under api.djenitor.com) to be then parsed back into a JavaScript Object and sent further to the frontend
React App (located under live.djenitor.com) that is going to represent it visually on a virtual fretboard. On the
server side the code will look like this:
const express = require("express");
const http = require("http");
const socketIo = require("socket.io");
const port = process.env.PORT || 5000;

const cors = require("cors");
const app = express();
app.use(cors({origin: "https://live.djenitor.com"}));

const server = http.createServer(app);
const io = socketIo(server);


io.on("connection", (socket) => {
  console.log(`> Client Connected: ${socket.id}`);

  socket.on("relay", (line) => {
    socket.broadcast.emit("notes", JSON.parse(line));
  });

  socket.on("disconnect", () => {
    console.log(`> Client Disconnected: ${socket.id}`);
  });
});
Once the server app gets a socket beacon with an event name of relay it’s going to send it further with the name of notes. To ensure the CORS working properly it has also been used the cors module for Node.js over the entire API. This is essential to make a stable connection between the local app and the server app.
Frontend • React.js
With a stream of data about the played notes that keeps flowing in from the backend, there was a need to display such data comprehensively and for this a React.js App has been created that can collect the data using the Socket.IO Client module and parse it through its internal state to be displayed on a virtual fretboard made with SVG.
At this moment React is the most popular framework for Frontend Apps so I won’t explain the black magic that it’s able to produce but what you need to know is that is fast, really fast! It also introduced the JSX syntax to mix the HTML to JavaScript without needing to have separate files and making the whole development process way faster.
Since it’s also standard these days, I’ve been using Hooks which relies on Funcitonal Components instead of
Class Components to manage the App, with focus on useState() and useEffect() to store and process incoming
state from the backend App.
The initial state of a Note Cycle of Analysis it’s declared this way:
import { useState } from "react";

const [notes, setNotes] = useState({
  "timestamp": 0,
  "strings": [
    {"name": "El", "value": 0, "pitched": false},
    {"name": "Bl", "value": 0, "pitched": false},
    {"name": "G",  "value": 0, "pitched": false},
    {"name": "D",  "value": 0, "pitched": false},
    {"name": "A",  "value": 0, "pitched": false},
    {"name": "Eh", "value": 0, "pitched": false},
    {"name": "Eh", "value": 0, "pitched": false},
    {"name": "F#", "value": 0, "pitched": false},
  ]
});
This way the initial state of the notes object is going to be the same as the previously mentioned Teensy JSON
encoded output that is going to come through the backend but with all the keys’ values defaulting to the neutral
variants. This state is going to be updated each time the Socket.IO Client will intercept a new message sent by
the backend, this way:
import { useEffect } from "react";

useEffect(() => {
    props.socket.on("notes", (data) => {
      setNotes(data);
    });
    props.socket.on("error", (err) => {
      console.log(`Socket.IO Front-end Error: ${err}`);
    });
}, [notes]);
Each message is going to define the string’s vibration (frequencies) of 1ms in time according to the previously described setup of an 8 string guitar. The message is going to be then compared to the matrix of frequencies of all the notes that can be reproduced on such instrument as below:
const fretboardModel = {
  "El": [330, 349, 370, 392, 415, 440, 466, 494, 523, 554, 587, 622, 659, 698, 740, 784, 831, 880, 932, 988, 1047, 1109, 1175, 1245, 1319],
  "Bl": [247, 262, 277, 294, 311, 330, 349, 370, 392, 415, 440, 466, 494, 523, 554, 587, 622, 659, 698, 740,  784,  831,  880,  932,  988],
  "G":  [196, 208, 220, 233, 247, 262, 277, 294, 311, 330, 349, 370, 392, 415, 440, 466, 494, 523, 554, 587,  622,  659,  698,  740,  784],
  "D":  [147, 156, 165, 175, 185, 196, 208, 220, 233, 247, 262, 277, 294, 311, 330, 349, 370, 392, 415, 440,  466,  494,  523,  554,  587],
  "A":  [110, 117, 123, 131, 139, 147, 156, 165, 175, 185, 196, 208, 220, 233, 247, 262, 277, 294, 311, 330,  349,  370,  392,  415,  440],
  "Eh": [ 82,  87,  92,  98, 104, 110, 117, 123, 131, 139, 147, 156, 165, 175, 185, 196, 208, 220, 233, 247,  262,  277,  294,  311,  330],
  "Bh": [ 62,  65,  69,  73,  78,  82,  87,  92,  98, 104, 110, 117, 123, 131, 139, 147, 156, 165, 175, 185,  196,  208,  220,  233,  247],
  "F#": [ 46,  49,  52,  55,  58,  62,  65,  69,  73,  78,  82,  87,  92,  98, 104, 110, 117, 123, 131, 139,  147,  156,  165,  175,  185]
}
In such a model the first value of each array is going to represent the string frequency when vibrating on empty frets, basically when no fret is pressed, while all the other frequencies will be mapped 1 to 1 to the original instrument fretboard frets. Once the messages come we can start defining the position of the notes on the SVG Fretboard by representing the notes as glowing yellow circles over the correct position according to the last cycle of data received.
const drawNotes = (string) => {
  let temp = [];
  const notation = {0: "El", 1: "Bl", 2: "G", 3: "D", 4: "A", 5: "Eh", 6: "Bh", 7: "F#"}[string];
  const {timestamp, strings} = notes;
  const position = fretboardModel[strings[string]["name"]].indexOf(strings[string]["value"]);
  const shift = 52;
  const posX = (70 * position);
  let lastFreq = 0;
  if(strings[string]["value"] !== 0) {
    temp.push(<circle
      r="15"
      cy="20"
      cx={posX !== 0 ? posX + shift : 50}
      fill="orange"
      stroke="grey"
      strokeWidth="2">
      </circle>
    )
  }
  return temp.map((item) => item);
}
A simulation of the notes variation on the sensor detached from the instrument
Static Site • Gatsby.js
This was not supposed to be documented here even though it has been part of my Project but at the time I created a simple Gatsby Website from a Starter to display information about the project and to make it look more professional such as other apps that have their domain where they gather clients and they showcase the app. The idea is that was not so relevant for the project itself and was mostly done because of adding more carrots to the stew if you know what I mean, basically I got extra credits for it during the final exams at University.
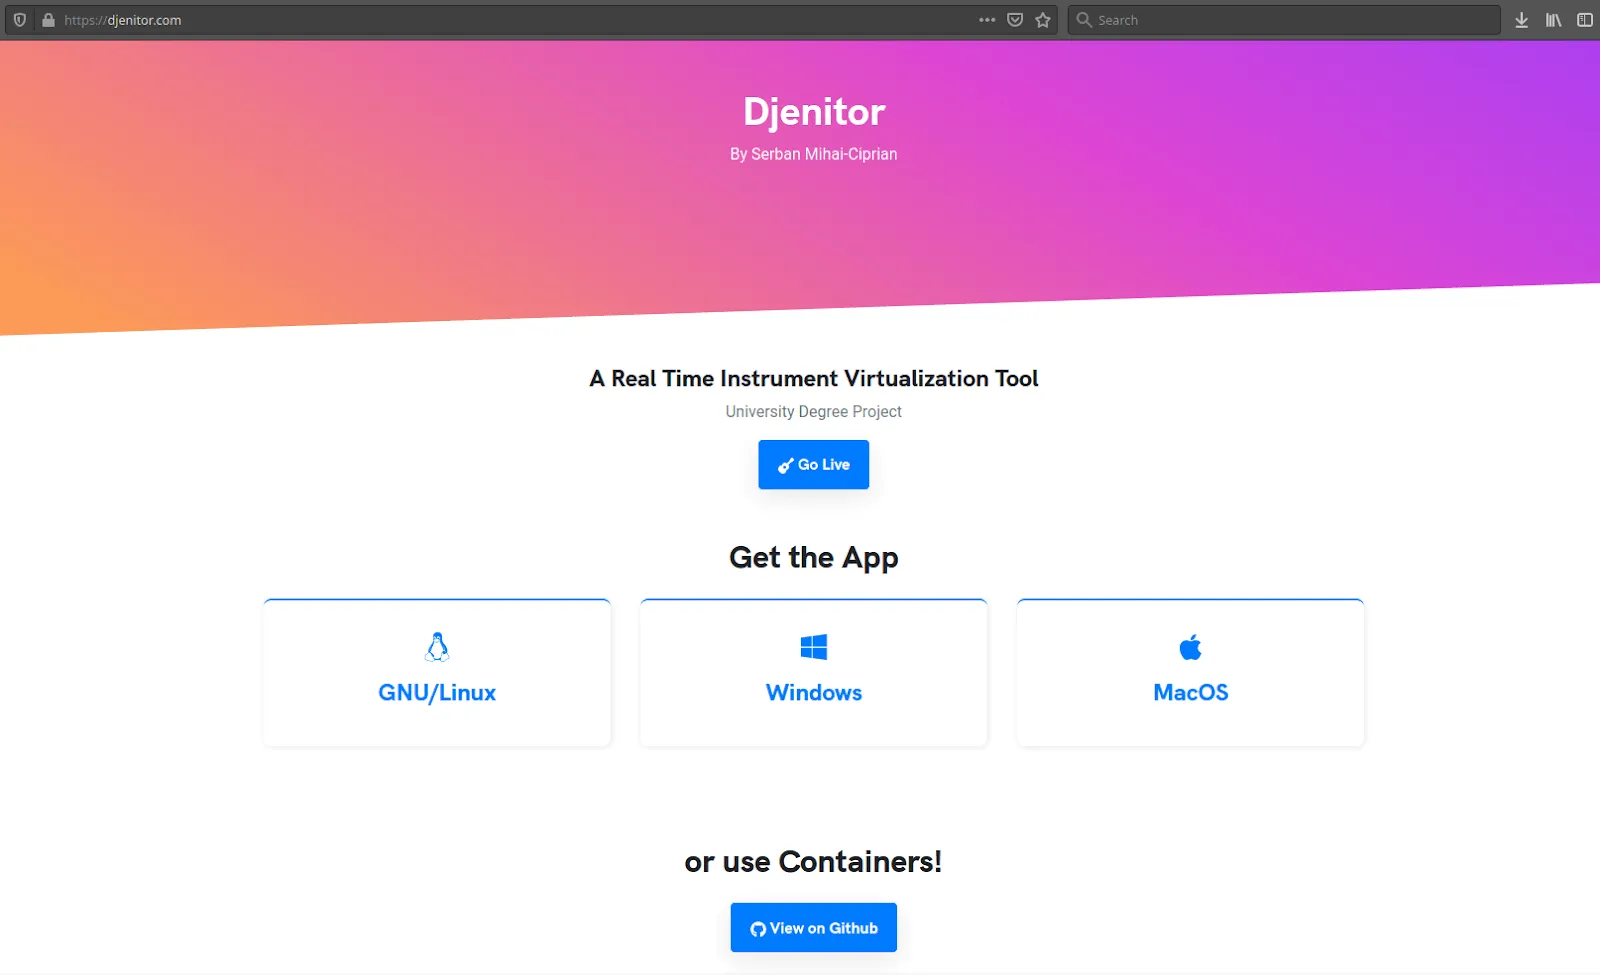
A screenshot of the presentation Website made with Gatsby
DevOps • AWS
The main goal of the whole solution is to be able to broadcast physical guitar notes to the internet so that anyone can see them in real-time once someone is playing the instrument with the sensor attached. Such a solution implies the use of different cloud services to facilitate the stream and the exposure of data to the public and for this, I’ve been using AWS (Amazon Web Services). There are over 100 services that AWS allows its users to take advantage of but I needed just a couple to implement the project.
EC2 • Elastic IP
To host the Backend API and the Frontend App, I used the EC2 (Elastic Compute Cloud) service that allows to spin a cloud instance (virtual machine) where we can install and configure everything we need.
To make it public (able to be reached by outside the Virtual Network where it belongs) I’ve created an Elastic IP and attached it to the instance. This also comes in handy when managing many instances and you need to change their outside bound often.
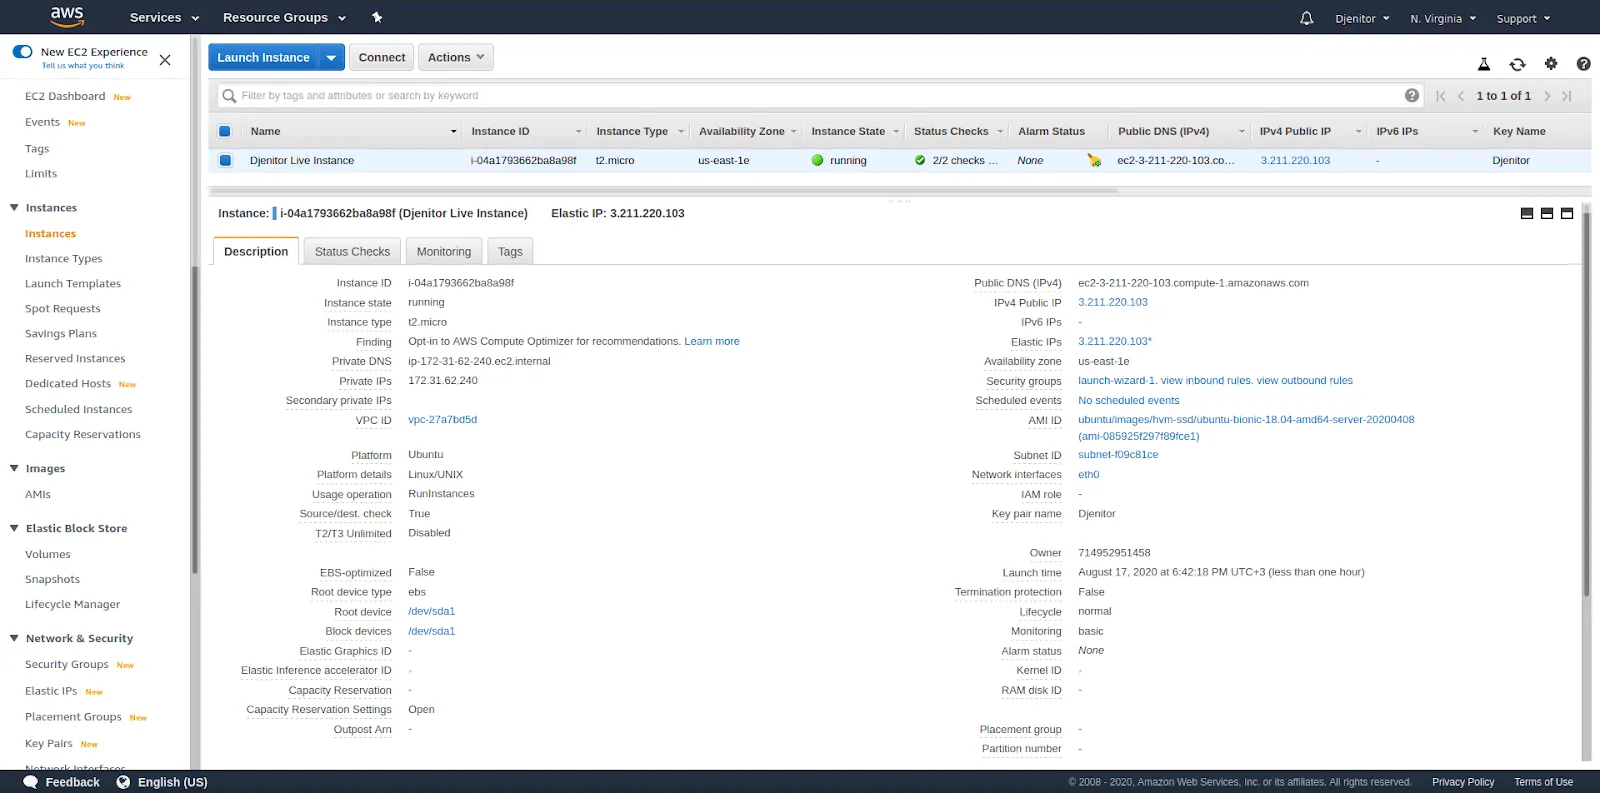
The EC2 Panel in AWS Console, where you can see details about the instances created
The instance type has been a simple t2.micro that is part of the AWS EC2 Free Tier and has minimal processing power but still enough for
such project since I was not expecting live traffic and didn’t need any scalability for the future.
Docker Containers
Since there is more than one service that’s running on the same instance, to manage the build and the deploy I’ve been using Docker Containers along with Docker Compose for orchestration. Docker allows a further level of virtualization that is properly referred to as containerization of the Apps by wrapping their runtime into an isolated runtime env that won’t be affected by the other containers in the same host environment. Both services have been containerized within a Linux Alpine distribution as per best practice, it’s an image that is lightweight and secure.
The Backend Service aka. the Express.js App needed just some dependencies and was generated from the node:13.12.0-alpine
image, the source code was copied into the container and build with the npm install command. The container will expose
to the host just the 5000 port where the API can be reached.
# Djenitor Backend | Prod Environment
# Install Dependencies and start a node process
FROM node:13.12.0-alpine
WORKDIR /app
ENV PATH /app/node_modules/.bin:$PATH
RUN apk add --no-cache --update python3 py3-pip make g++
COPY package.json ./
COPY package-lock.json ./
RUN npm install
RUN npm install [email protected] -g --silent
COPY . ./
EXPOSE 5000
CMD ["npm", "start"]
The Frontend Service aka. the React.js App was built through a so-called multistage which means building
different containers within the same Docker Image. This has been done since the App needed to be running
in production mode and for such a thing to happen it needs to be served to the host through an internal web server within
the container.
# Djenitor Front-End | Build Environment
# Install Dependencies and build a prod distribution
FROM node:13.12.0-alpine AS build
WORKDIR /app
ENV PATH /app/node_modules/.bin:$PATH
COPY package.json ./
COPY yarn.lock ./
RUN yarn install --silent
RUN yarn add [email protected] -g --silent
COPY . ./
RUN yarn build

# Djenitor Front-End | Prod Environment
# Move the built distribution into a webserver container to serve the content
FROM nginx:stable-alpine
COPY --from=build /app/build /usr/share/nginx/html
COPY nginx/nginx.conf /etc/nginx/conf.d/default.conf
EXPOSE 80
CMD ["nginx", "-g", "daemon off;"]
The --from=build flag is referring to the first container created, that is the Frontend App itself that is then
passed to the second container aka an Nginx web server to expose the React.js App to the 80
port.
Since these 2 services needed to coexist together, I’ve been using Docker Compose to orchestrate the services, their build, and deploy on the host instance. The template defining the services, volumes, and port bindings looks like this:
version: "3.3"
services:
  react:
    container_name: djenitor-frontend
    restart: always
    build:
      context: ./frontend
      dockerfile: Dockerfile
    ports:
      - "${REACT_PORT}:80"
    volumes:
      - react-app:/app
    depends_on:
      - database
  express:
    container_name: djenitor-backend
    restart: always
    build:
      context: ./backend
      dockerfile: Dockerfile
    ports:
      - "${EXPRESS_PORT}:5000"
    volumes:
      - express-app:/app
    depends_on:
      - database
volumes:
  react-app:
  express-app:
The ${} values are just Environment Variables that can be retrieved from a local .env file created in the same
path as the docker-compose.yml file. Once a docker-compose up -d is executed on the host, it will build and start the services according to the Dockerfiles
instructions and bind the services to the described ports from the containers to the host environment.
Reverse Proxy and HTTPS
At this point, there was a need to expose the ports further to the internet and the public IP so that we can access
the running Apps inside the containers. A Reverse Proxy with Nginx has been installed and configured on the host EC2
instance, its purpose is to reroute incoming traffic to the correct port when the corresponding subdomain of djenitor.com
is requested.
The Port and Domain setup for such project has the following rules:
- Backend • Host: 8001 • Container: 5000 • Subdomain:
api.djenitor.com - Frontend • Host: 8002 • Container: 80 • Subdomain:
live.djenitor.com
The tricky part was to make the Backend Accept Socket.IO Incoming data because of missing dependencies on the standard
Nginx packages for Ubuntu, before configuring it I installed the Nginx-full and Nginx-extras on the host and
created the configuration file for both backend and frontend. the location /socket.io/ {} block of configuration
is taking care of the Socket.IO Path endpoint that is common to all configurations with such library unless override,
while the access headers that are set with more_set_headers come from the extras package of Nginx.
upstream api_server_djenitor {
    server 0.0.0.0:8001 fail_timeout=0;
}
server {
    server_name api.djenitor.com;
    access_log  /var/log/nginx/djenitor-api-access.log;
    error_log  /var/log/nginx/djenitor-api-error.log info;
    keepalive_timeout 5;
    location / {
      proxy_http_version 1.1;
      proxy_set_header Upgrade $http_upgrade;
      proxy_set_header Connection "upgrade";
      more_set_headers 'Access-Control-Allow-Origin:https://live.djenitor.com';
      more_set_headers 'Access-Control-Allow-Methods: GET,POST,OPTIONS';
      more_set_headers 'Access-Control-Allow-Credentials:true';
      more_set_headers 'Access-Control-Allow-Headers:DNT,X-Mx-ReqToken,Keep-Alive,User-Agent,X-Requested-With,If-Modified-Since,Cache-Control,Content-Type';
      proxy_set_header X-Forwarded-For \$proxy_add_x_forwarded_for;
      proxy_set_header Host \$http_host;
      proxy_set_header X-Forwarded-Proto \$scheme;
      proxy_redirect off;
      client_max_body_size 25M;
      if (!-f \$request_filename) {
          proxy_pass http://api_server_djenitor;
          break;
      }
    }
    location /socket.io/ {
      proxy_set_header Upgrade $http_upgrade;
      proxy_set_header Connection "upgrade";
      proxy_http_version 1.1;
      proxy_set_header X-Forwarded-For $proxy_add_x_forwarded_for;
      proxy_set_header Host $host;
      proxy_pass http://api_server_djenitor/socket.io/;
    }

    listen 443 ssl; # managed by Certbot
    ssl_certificate /etc/letsencrypt/live/api.djenitor.com/fullchain.pem; # managed by Certbot
    ssl_certificate_key /etc/letsencrypt/live/api.djenitor.com/privatekey.pem; # managed by Certbot
    include /etc/letsencrypt/options-ssl-nginx.conf; # managed by Certbot
    ssl_dhparam /etc/letsencrypt/ssl-dhparams.pem # managed by Certbot
}
server {
  server_name ${API_DOMAIN};
  listen 80;
}
This will route the incoming traffic to the correct container according to the previously mentioned rules. But this
will just cover the HTTP not secured traffic, to patch the webserver configuration with HTTPS I’ve been using
a convenient tool called Certbot that can create SSL Certificates with Let’s Encrypt and attach them to the
already configured setup on any web server (Nginx, Apache…)
Cloudfront • S3 • ACM
The previously mentioned Gatsby Website has been hosted through Cloudfront which is a service that provides a
distribution, basically an endpoint of such randomhash1029.cloudfront.com that can be used to access static
resources from an S3 Bucket, another service that can store static assets. The Gatsby Website is made by static assets
such as HTML, CSS, and JS files that are going to be interpreted by your browser if they can be reached and loaded
through an endpoint.
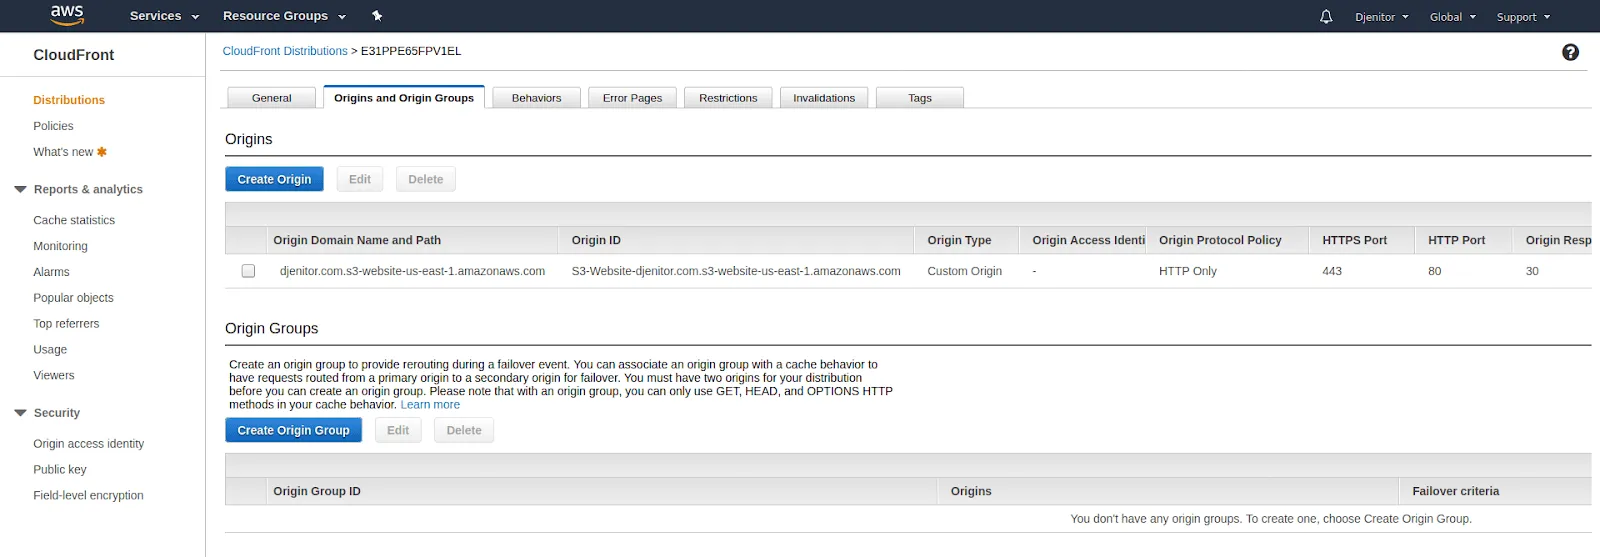
The Cloudfront Distributions that have been created in order to route the traffic the S3 Buckets that hold their static assets
The ACM (Amazon Certificate Manager) has been used to issue a valid certificate for the djenitor.com domain that
was going to be the entry point for both the Server Backend and Frontend Apps and the Static Website made with Gatsby.
Such Certificates are essential to be able to route traffic through a custom domain name over the Cloudfront distribution.

The ACM Service in AWS that allows to issue certificates for a custom domain to be used as endpoint for other services
CloudFlare
Since the djenitor.com domain has been purchased from GoDaddy, its management has been
changed to CloudFlare which can be described as a middleware between the Origin and the End Users. It’s a service
that provides many advantages and being itself a middleware it means that all the traffic trying to reach my domain
is going to pass and being filtered by CloudFlare first. This implies the fact that many operations can be executed
before a request may hit the Origin servers or services that are hosting the Apps. It also offers an awesome Cache that
it’s top tier due to the many datacenters across the whole world.
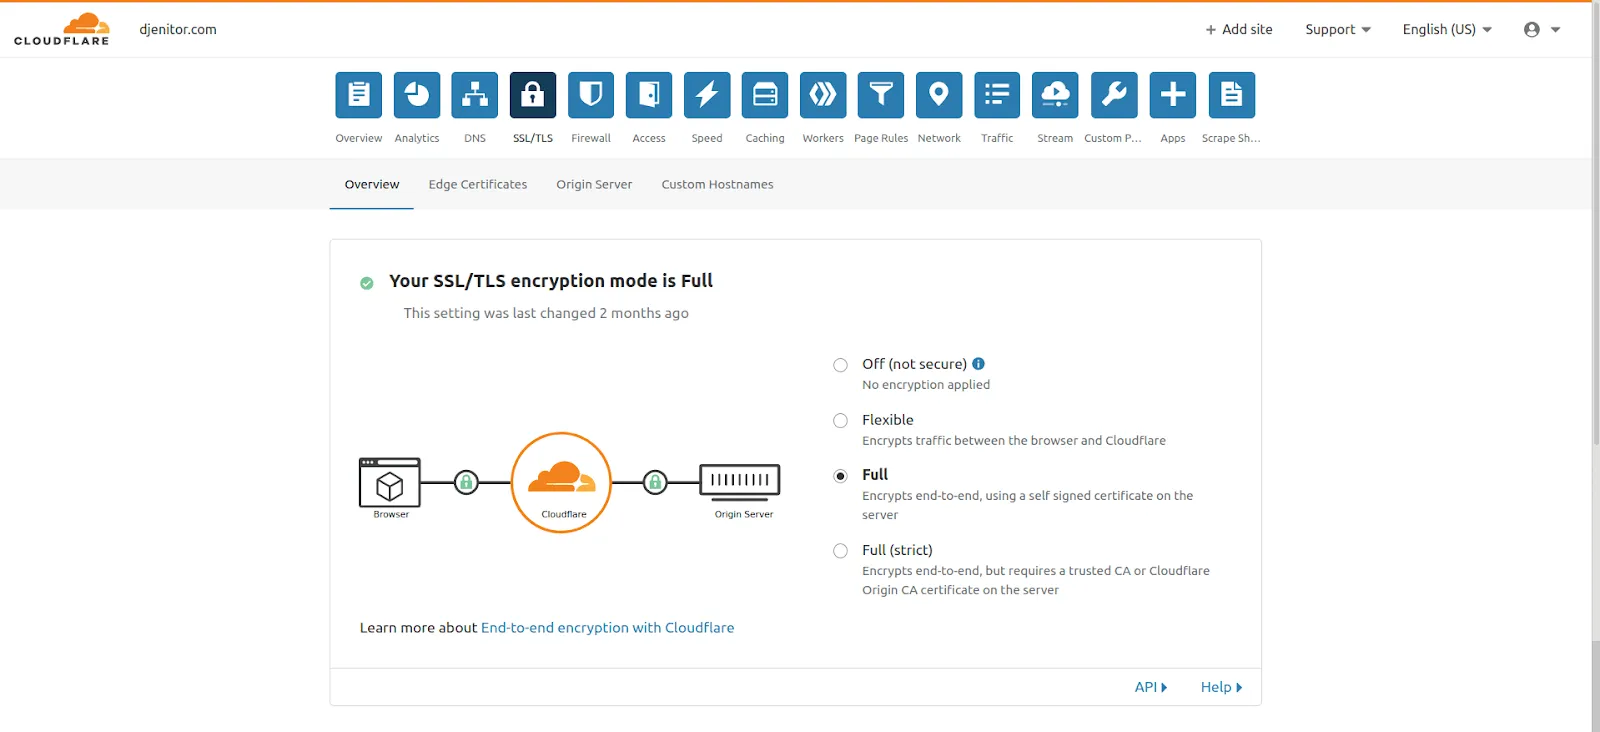
The SSL/TLS Pannel in CloudFlare that shows the Full Encryption between the Origin and the End Users
CloudFlare itself it’s a suite of many tools that come in handy when managing domains, it has many services such as DNS, Workers, Page Rules, different levels of filtering and rerouting traffic that it’s a shame not to use it for your’s everyday domain management.
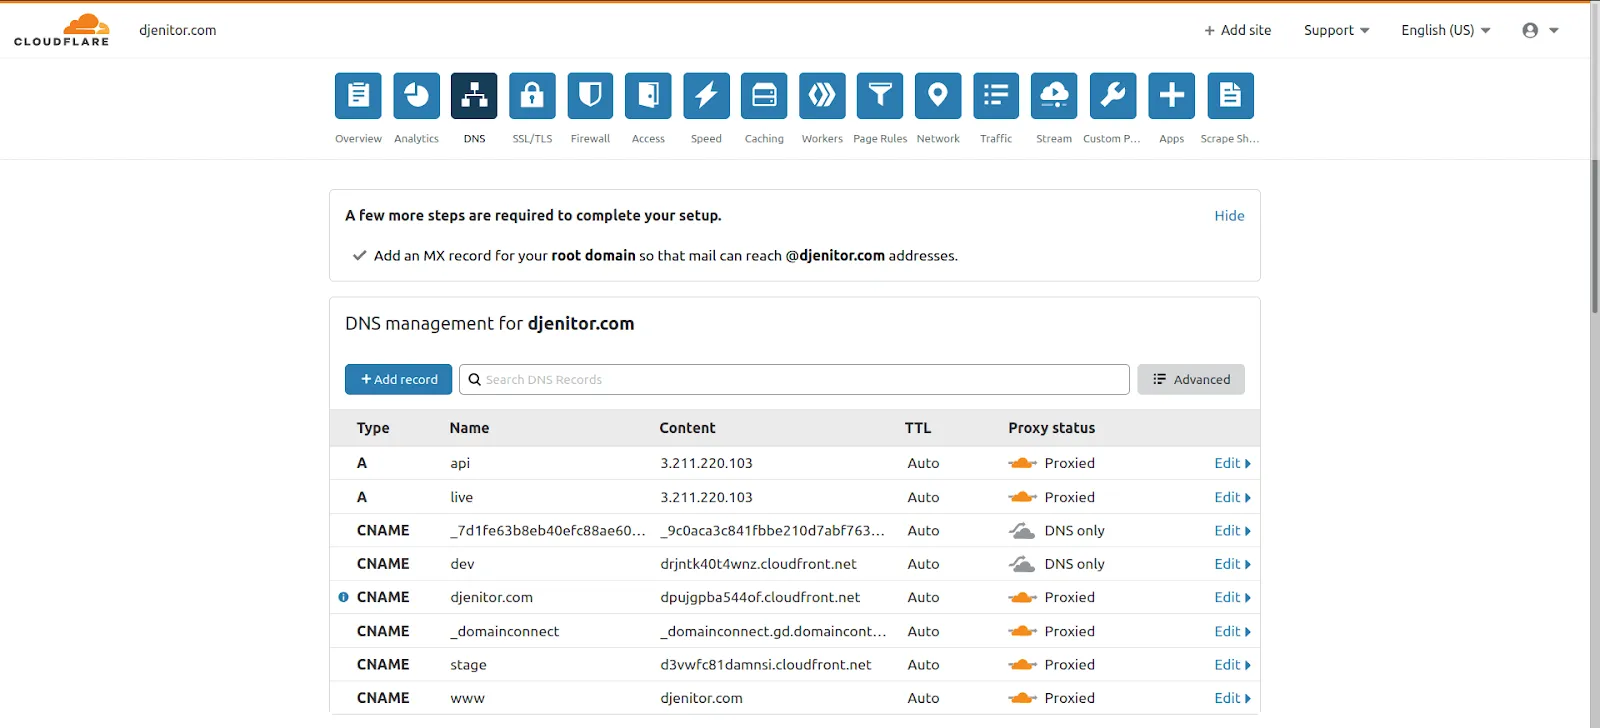
The DNS Panel in CloudFlare that allows the routing of traffic across custom origins defined either by IP or by name
Future Implementation
In conclusion, this solution based on physically capture the individual output of each instrument string can further be used for different projects that may include include:
- Online teaching, from a musician to the public
- Videogames such as Rocksmith but based on real-time note analysis instead of using AI to detect the correct notes played on each string
- An automatic tablature system that can map the tabs of a particular song in real-time while being played instead of writing it by hand as nowadays
Everything depends on how you want and can parse the data that is collected by the sensor.
